Fatigue Crack Growth Rate Properties
For some components the crack propagation life is neglected in design because stress levels are high, and/or the critical flaw size small. For other components the crack growth life might be a substantial portion of the total life of the assembly. Moreover, preexisting flaws or sharp design features may significantly reduce or nearly eliminate the crack initiation portion of the fatigue life of a component. The useful life of these components may be governed by the rate of subcritical crack propagation.
Aircraft fuselage structure is a good example of structure that is based largely on a slow crack growth rate design. Many years ago, the USAF reviewed a great number of malfunction reports from a variety of aircraft. The reports showed that the preponderance of structural failures occurred from 1) built-in preload stresses, 2) material flaws and 3) flaw caused by in-service usage. These facts led to a design approach that required the damage tolerance analysis to assume a material flaw exists in the worst orientation and at the most undesirable location. The analysis helps to ensure that structures are designed that will support slow stable crack growth until the crack reaches a length where it can reliable be detected using NDT methods.
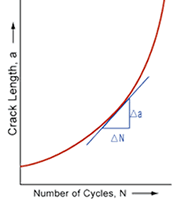
 The rate of fatigue crack propagation is determined by subjecting fatigue-cracked specimens, like the compact specimen used in fracture toughness testing, to constant-amplitude cyclic loading. The incremental increase in crack length is recorded along with the corresponding number of elapsed load cycles acquire stress intensity (K), crack length (a), and cycle count (N) data during the test. The data is presented in an “a versus N” curve as shown in the image to the right. Various a versus N curves can be generated by varying the magnitude of the cyclic loading and/or the size of the initial crack.
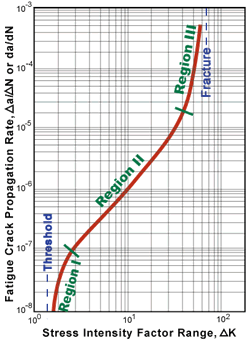
 The data can be reduced to a single curve by presenting the data in terms of crack growth rate per cycle of loading (Δa/ ΔN or da/dN) versus the fluctuation of the stress-intensity factor at the tip of the crack (ΔKI). ΔKI is representative of the mechanical driving force, and it incorporates the effect of changing crack length and the magnitude of the cyclic loading. (See the page on fracture toughness for more information on the stress-intensity factor.) The most common form of presenting fatigue crack growth data is a log-log plot of da/dN versus ΔKI.
The fatigue crack propagation behavior of many materials can be divided into three regions as shown in the image. Region I is the fatigue threshold region where the Dk is too low to propagate a crack. Region II encompasses data where the rate of crack growth changes roughly linearly with a change in stress intensity fluctuation. In region III, small increases in the stress intensity amplitude, produce relatively large increases in crack growth rate since the material is nearing the point of unstable fracture.