Complex Impedance Plane: Eddy Current Scope
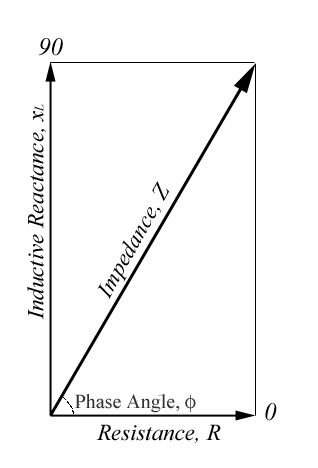
 Electrical Impedance (Z), is the total opposition that a circuit presents to an alternating current. Impedance, measured in ohms, may include resistance (R), inductive reactance (XL), and capacitive reactance (XC). Eddy current circuits usually have only R and (XL) components. As discussed in the page on impedance, the resistance component and the reactance component are not in phase, so vector addition must be used to relate them with impedance. For an eddy current circuit with resistance and inductive reactance components, the total impedance is calculated using the following equation.
You will recall that this can be graphically displayed using the impedance plane diagram as seen above. Impedance also has an associated angle, called the phase angle of the circuit, which can be calculated by the following equation.
The impedance plane diagram is a very useful way of displaying eddy current data. As shown in the figure below, the strength of the eddy currents and the magnetic permeability of the test material cause the eddy current signal on the impedance plane to react in a variety of different ways.

If the eddy current circuit is balanced in air and then placed on a piece of aluminum, the resistance component will increase (eddy currents are being generated in the aluminum and this takes energy away from the coil, which shows up as resistance) and the inductive reactance of the coil decreases (the magnetic field created by the eddy currents opposes the coil's magnetic field and the net effect is a weaker magnetic field to produce inductance). If a crack is present in the material, fewer eddy currents will be able to form and the resistance will go back down and the inductive reactance will go back up. Changes in conductivity will cause the eddy current signal to change in a different way.
When a probe is placed on a magnetic material such as steel, something different happens. Just like with aluminum (conductive but not magnetic), eddy currents form, taking energy away from the coil, which shows up as an increase in the coils resistance. And, just like with the aluminum, the eddy currents generate their own magnetic field that opposes the coils magnetic field. However, you will note for the diagram that the reactance increases. This is because the magnetic permeability of the steel concentrates the coil's magnetic field. This increase in the magnetic field strength completely overshadows the magnetic field of the eddy currents. The presence of a crack or a change in the conductivity will produce a change in the eddy current signal similar to that seen with aluminum.
In the applet below, liftoff curves can be generated for several nonconductive materials with various electrical conductivities. With the probe held away from the metal surface, zero and clear the graph. Then slowly move the probe to the surface of the material. Lift the probe back up, select a different material and touch it back to the sample surface.
Experiment
Generate a family of liftoff curves for the different materials available in the applet using a frequency of 10kHz. Note the relative position of each of the curves. Repeat at 500kHz and 2MHz. (Note: it might be helpful to capture an image of the complete set of curves for each frequency for comparison.)
- Which frequency would be best if you needed to distinguish between two high conductivity materials?
- Which frequency would be best if you needed to distinguish between two low conductivity materials?
The impedance calculations in the above applet are based on codes by Jack Blitz from "Electrical and Magnetic Methods of Nondestructive Testing," 2nd ed., Chapman and Hill.